|
|
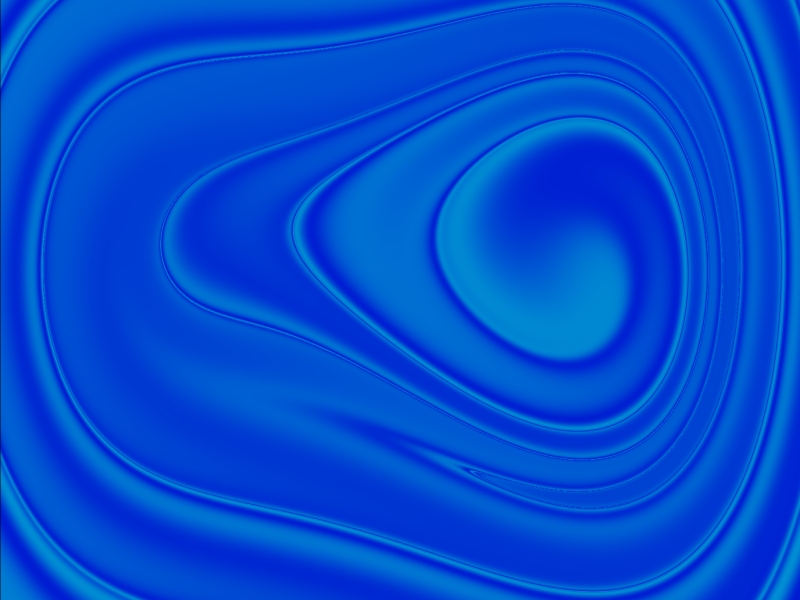
This image created with the
spectrum intercept algorithm
is based on the dynamical system expressed by,
x''=a*cos(ω*t+φ)-b*(x-x3)-μ*x',
where x' is the first derivative of x with respect to time, t, and x'' is the second derivative of x with respect to time.
The state variables here are x and x'. The domain of this image in the map of possible states for this system is, (-2.1267, 4.836)/(2.6697, -6.073) The parameter values are, a=3, ω=0.2, b=-3, and μ=0.2 This image differs from the Noise image only in that the integration time increment used here is about half as long as in as in Noise. Whether it is noise or music seems to depend on how closely you look at it. |